


A new template has emerged for those looking to trade Solana, the sixth-largest cryptocurrency by market cap. Prominent market analyst ZYN shared this systematic template in his recent tweet, noting it was “all you need to trade Solana.”
Trading Strategy to Profit From Solana
His Solana trading hack brings into consideration a precise, repeating pattern that has formed since the second quarter of the year. The analysis shows the token typically corrects by about 25% before rebounding by 50% to 60%.
This pattern has emerged three times, suggesting a structured cycle of profit-taking followed by renewed accumulation. Analysts tracking these patterns have noted that Solana’s market behavior appears logical, with profit-taking phases followed by accumulation.
According to the accompanying chart shared by ZYN, this pattern has recurred three times since the second quarter. The first recorded drop was 24.43%, followed by a recovery that initiated a broader uptrend.
The second retracement measured 24.06%, leading to another surge that produced higher highs. The latest correction reached 24.70%, stabilizing near the $188–$190 range before the token climbed past $220.
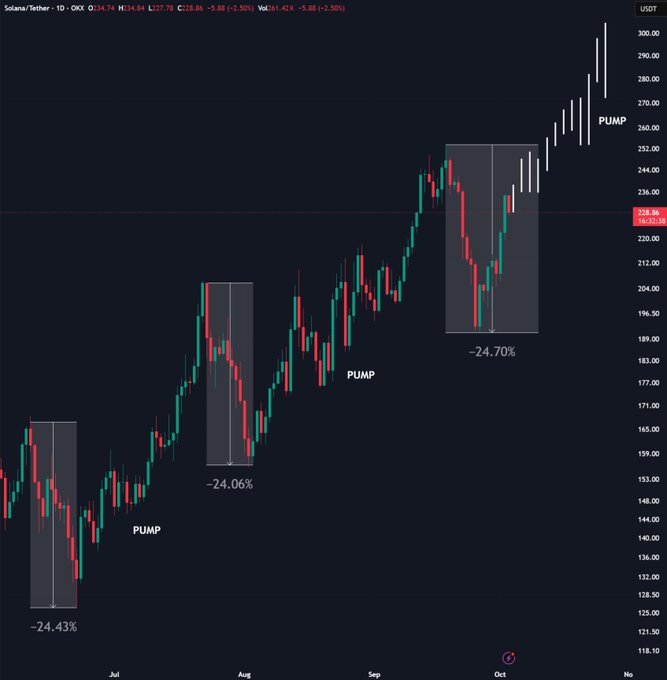
The repetition of these moves signals structured accumulation during dips and active market participation. Meanwhile, a reaction from Roma (@Roma_spelvin) summarized the pattern as “buy the 25% dips, ride the 50% pops.” Another observer, Autumn Riley (@Autumn_Rileyy), forecasted Solana reaching $300 this month based on the continuation of the cycle.
Market Data and Exchange Flow Patterns
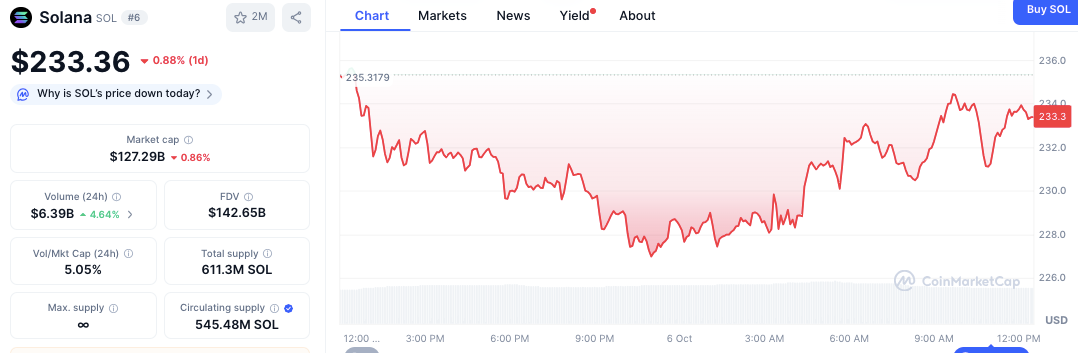
According to CoinMarketCap, Solana traded at $233.36, showing a 0.88% daily decline. Its market capitalization stood at $127.29 billion, with a fully diluted valuation of $142.65 billion.
However, the 24-hour trading volume increased by 4.64% to $6.39 billion, resulting in a liquidity ratio of 5.05%. The circulating supply reached 545.48 million SOL out of a total of 611.3 million, with on-chain burns offsetting inflation from staking rewards.
Moreover, Coinglass data displayed alternating exchange inflows and outflows that matched the token’s price swings. January saw inflows of over $6 billion and outflows of more than $8 billion amid strong volatility. From February to May, activity was balanced, marking a period of market consolidation.
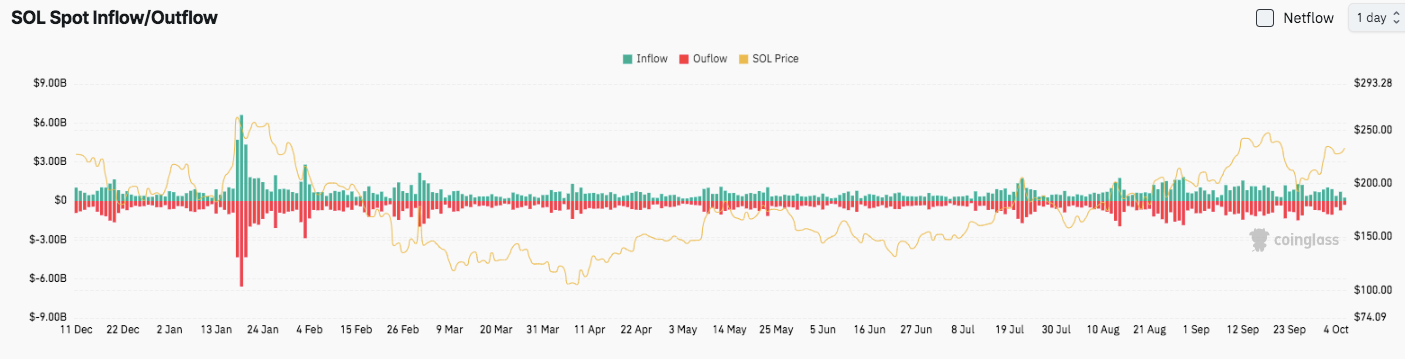
Renewed inflows appeared in June and July, coinciding with a price increase from $140 to above $200. By late September, inflows again dominated as Solana surpassed $250, maintaining high liquidity and trading participation.
Holding Through Cycles Yields Stronger Returns
The observed consistency in Solana’s correction and recovery phases attests to sustained investor confidence. Each dip has served as a reset before renewed buying activity drives the next rally. This structure reflects more than short-term speculation; it displays a growing market with organized accumulation.
While short-term traders may profit from temporary gains, the data also suggests that patient SOL holders benefit most from this pattern. Investors who maintain positions through corrections have historically capitalized on full rally cycles, resulting in more substantial overall returns.


