


Litecoin (LTC) is showing signs of a strong resurgence, prompting analysts and traders to speculate that the cryptocurrency could experience a major price surge in the near future. After a long period of consolidation, the charts are proving that Litecoin is positioning itself for a breakout that could take it to new highs, possibly as high as $750.
Price Action and Key Resistance Levels
Litecoin’s price has been consolidating within a well-defined range for several months, with strong support around the lower trendline and resistance near the $100 to $115 zone. The lower trendline has been tested multiple times, indicating strong buying interest at these levels. On the other hand, the upper trendline has acted as firm resistance, preventing further upward movement.
In a recent analysis, pseudonymous chartist Captain Faibik highlighted the symmetrical triangle pattern on Litecoin’s weekly chart, where its price has been forming higher lows and lower highs since 2018. The apex of the triangle is close to approaching its apex, which suggests that a breakout is imminent.
Given the favorable price action near the support levels, Faibik believes a bullish breakout is more likely to happen. Moreover, a breakout above $115 could open the way for a rally, bringing Litecoin closer to a potential all-time high of $750. At the current price of $133.22, hitting the $750 target demands a surge of nearly 463%.

Fibonacci Levels and Bullish Continuation
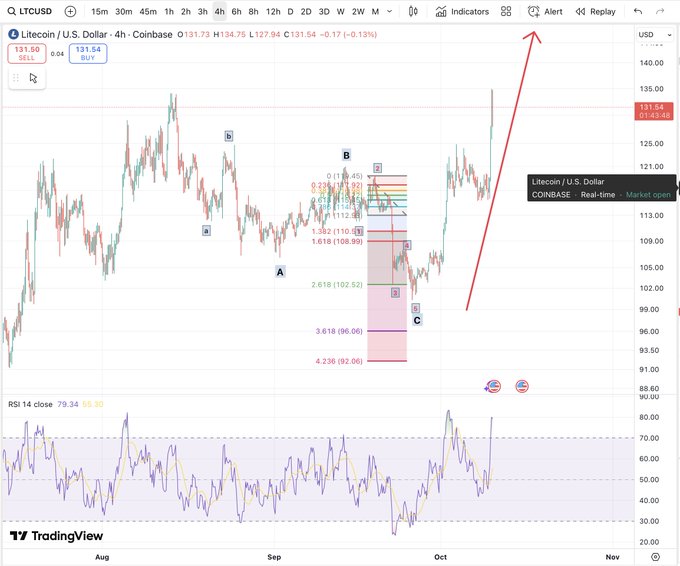
Matthew Dixon, a veteran financial trader, has also been following Litecoin’s price movements, noting a strong bullish pattern supported by a clear wave structure. According to Dixon, Litecoin has been following an ABC correction pattern, which has now shifted into a five-wave upward trend.
The strong upward momentum has pushed Litecoin beyond Fibonacci retracement levels, including the 1.618 extension at $108.99, signaling that the bullish trend is likely to continue.
#Litecoin is performing well according to our wavecount with a clear 5 waves higher following the ABC 'FLAT' correction pic.twitter.com/aBEicwcQPD
— Matthew Dixon – Veteran Financial Trader (@mdtrade) October 10, 2025
The price recently bounced at the 2.618 Fibonacci level around $102.52, further supporting the idea that the upward momentum is intact. Dixon’s analysis hints at a short-term price target of above $140 if Litecoin continues its bullish trajectory.
According to a chart shared by Matthew Dixon, the Relative Strength Index (RSI) for Litecoin currently stands at 79.34, indicating it is in the overbought zone. This high RSI reading signals that Litecoin may experience a short-term pullback or consolidation.
The growing market interest, alongside positive technical indicators, has sparked discussion in the community. Analysts such as Captain Faibik and Matthew Dixon are highlighting Litecoin’s bullish possibility.
Litecoin’s Market Position
As of press time, Litecoin was trading at $133.22, up 13.47% in the last 24 hours. The current market capitalization stands at $10.18 billion, with a circulating supply of 76.39 million LTC coins. Litecoin’s 24-hour trading volume is approximately $2.41 billion, reflecting strong investor interest.


