


Dogecoin is trading back at a long-term ascending support trendline that previously marked major cycle bottoms, according to a widely shared TradingView chart published on X. The analyst behind the post argues that the current structure mirrors prior inflection points that preceded multi-thousand-percent rallies in earlier market cycles.
Dogecoin Tests Multi-Cycle Ascending Support
The chart, spanning from 2014 through 2026 on a multi-week timeframe, shows Dogecoin compressing toward the lower boundary of a broad ascending channel that has defined the price structure across multiple cycles.
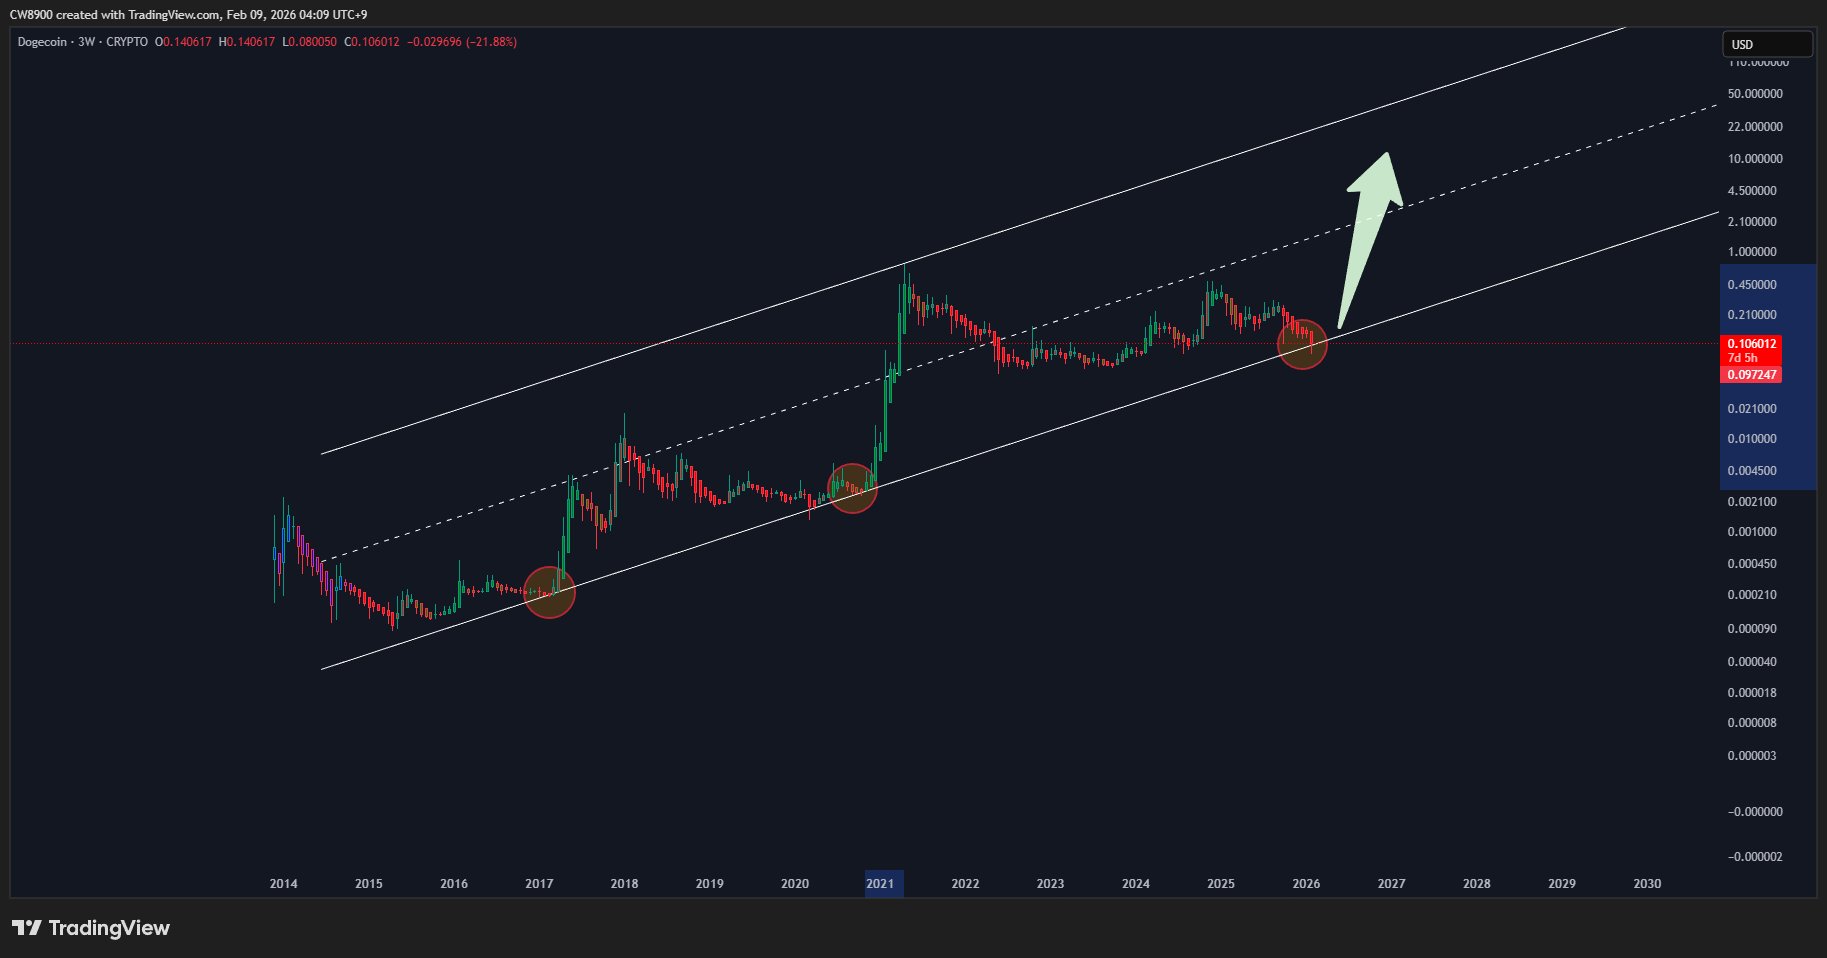
Red-circled zones on the chart highlight similar touches of the lower trendline in prior years, notably before the 2017 breakout and the 2020-2021 surge. In both instances, the price rebounded sharply after testing long-term structural support.
Following its 2017 base, Dogecoin rose to approximately 9,200% over roughly 300 days. During the subsequent cycle, the token advanced to around 26,485% in about 154 days after establishing its 2020 floor. The analyst, known by the pseudonym CW, claims the current setup represents a comparable retest of that structural base.
Historical Rally Data Anchors Dogecoin Bullish Case
The comparison relies on Dogecoin’s historical price expansion following prolonged consolidation near the channel’s lower boundary. Technically, a successful hold of multi-year support can act as a positioning reset. Extended drawdowns often flush leveraged positioning and compress speculative excess, and in prior cycles, Dogecoin spent months compressing before momentum accelerated rapidly.
However, historical returns do not guarantee repetition. Market structure has evolved materially since earlier cycles, with derivatives markets, broader retail access, and increased liquidity depth playing larger roles in price discovery.
Structural Considerations and Liquidity Dynamics
From a market mechanics standpoint, the significance of the level lies less in the historical comparisons and more in its structural function.
Multi-cycle trendlines often act as long-term cost-basis anchors for traders. A sustained defense of this area could reinforce confidence among longer-term holders, while a breakdown could trigger forced deleveraging across perpetual futures markets.
Dogecoin’s supply profile, inflationary but widely distributed, also differs from fixed-cap assets, meaning its bullish moves are more sentiment-driven than supply-shock driven. Thus, as of the time of writing, price remains within the channel rather than breaking decisively above resistance. At press time, DOGE was trading at $0.095, down 3.55% over the past 24 hours.
The analyst concludes that a “huge rise” could follow if historical symmetry holds. Whether the level produces that effect will depend on confirmation through sustained higher highs, expanding spot volume, and broader risk appetite conditions. Until then, the multi-year support zone remains the key reference point for market participants monitoring Dogecoin’s long-term structure.


