


A widely tracked technical signal on Bitcoin is once again gaining traction among analysts, with historical data suggesting it may consistently precede the final capitulation phase before a new bull market begins.
Bitcoin SMA Crossover Signals “Golden Opportunity,” Says Ali Martinez
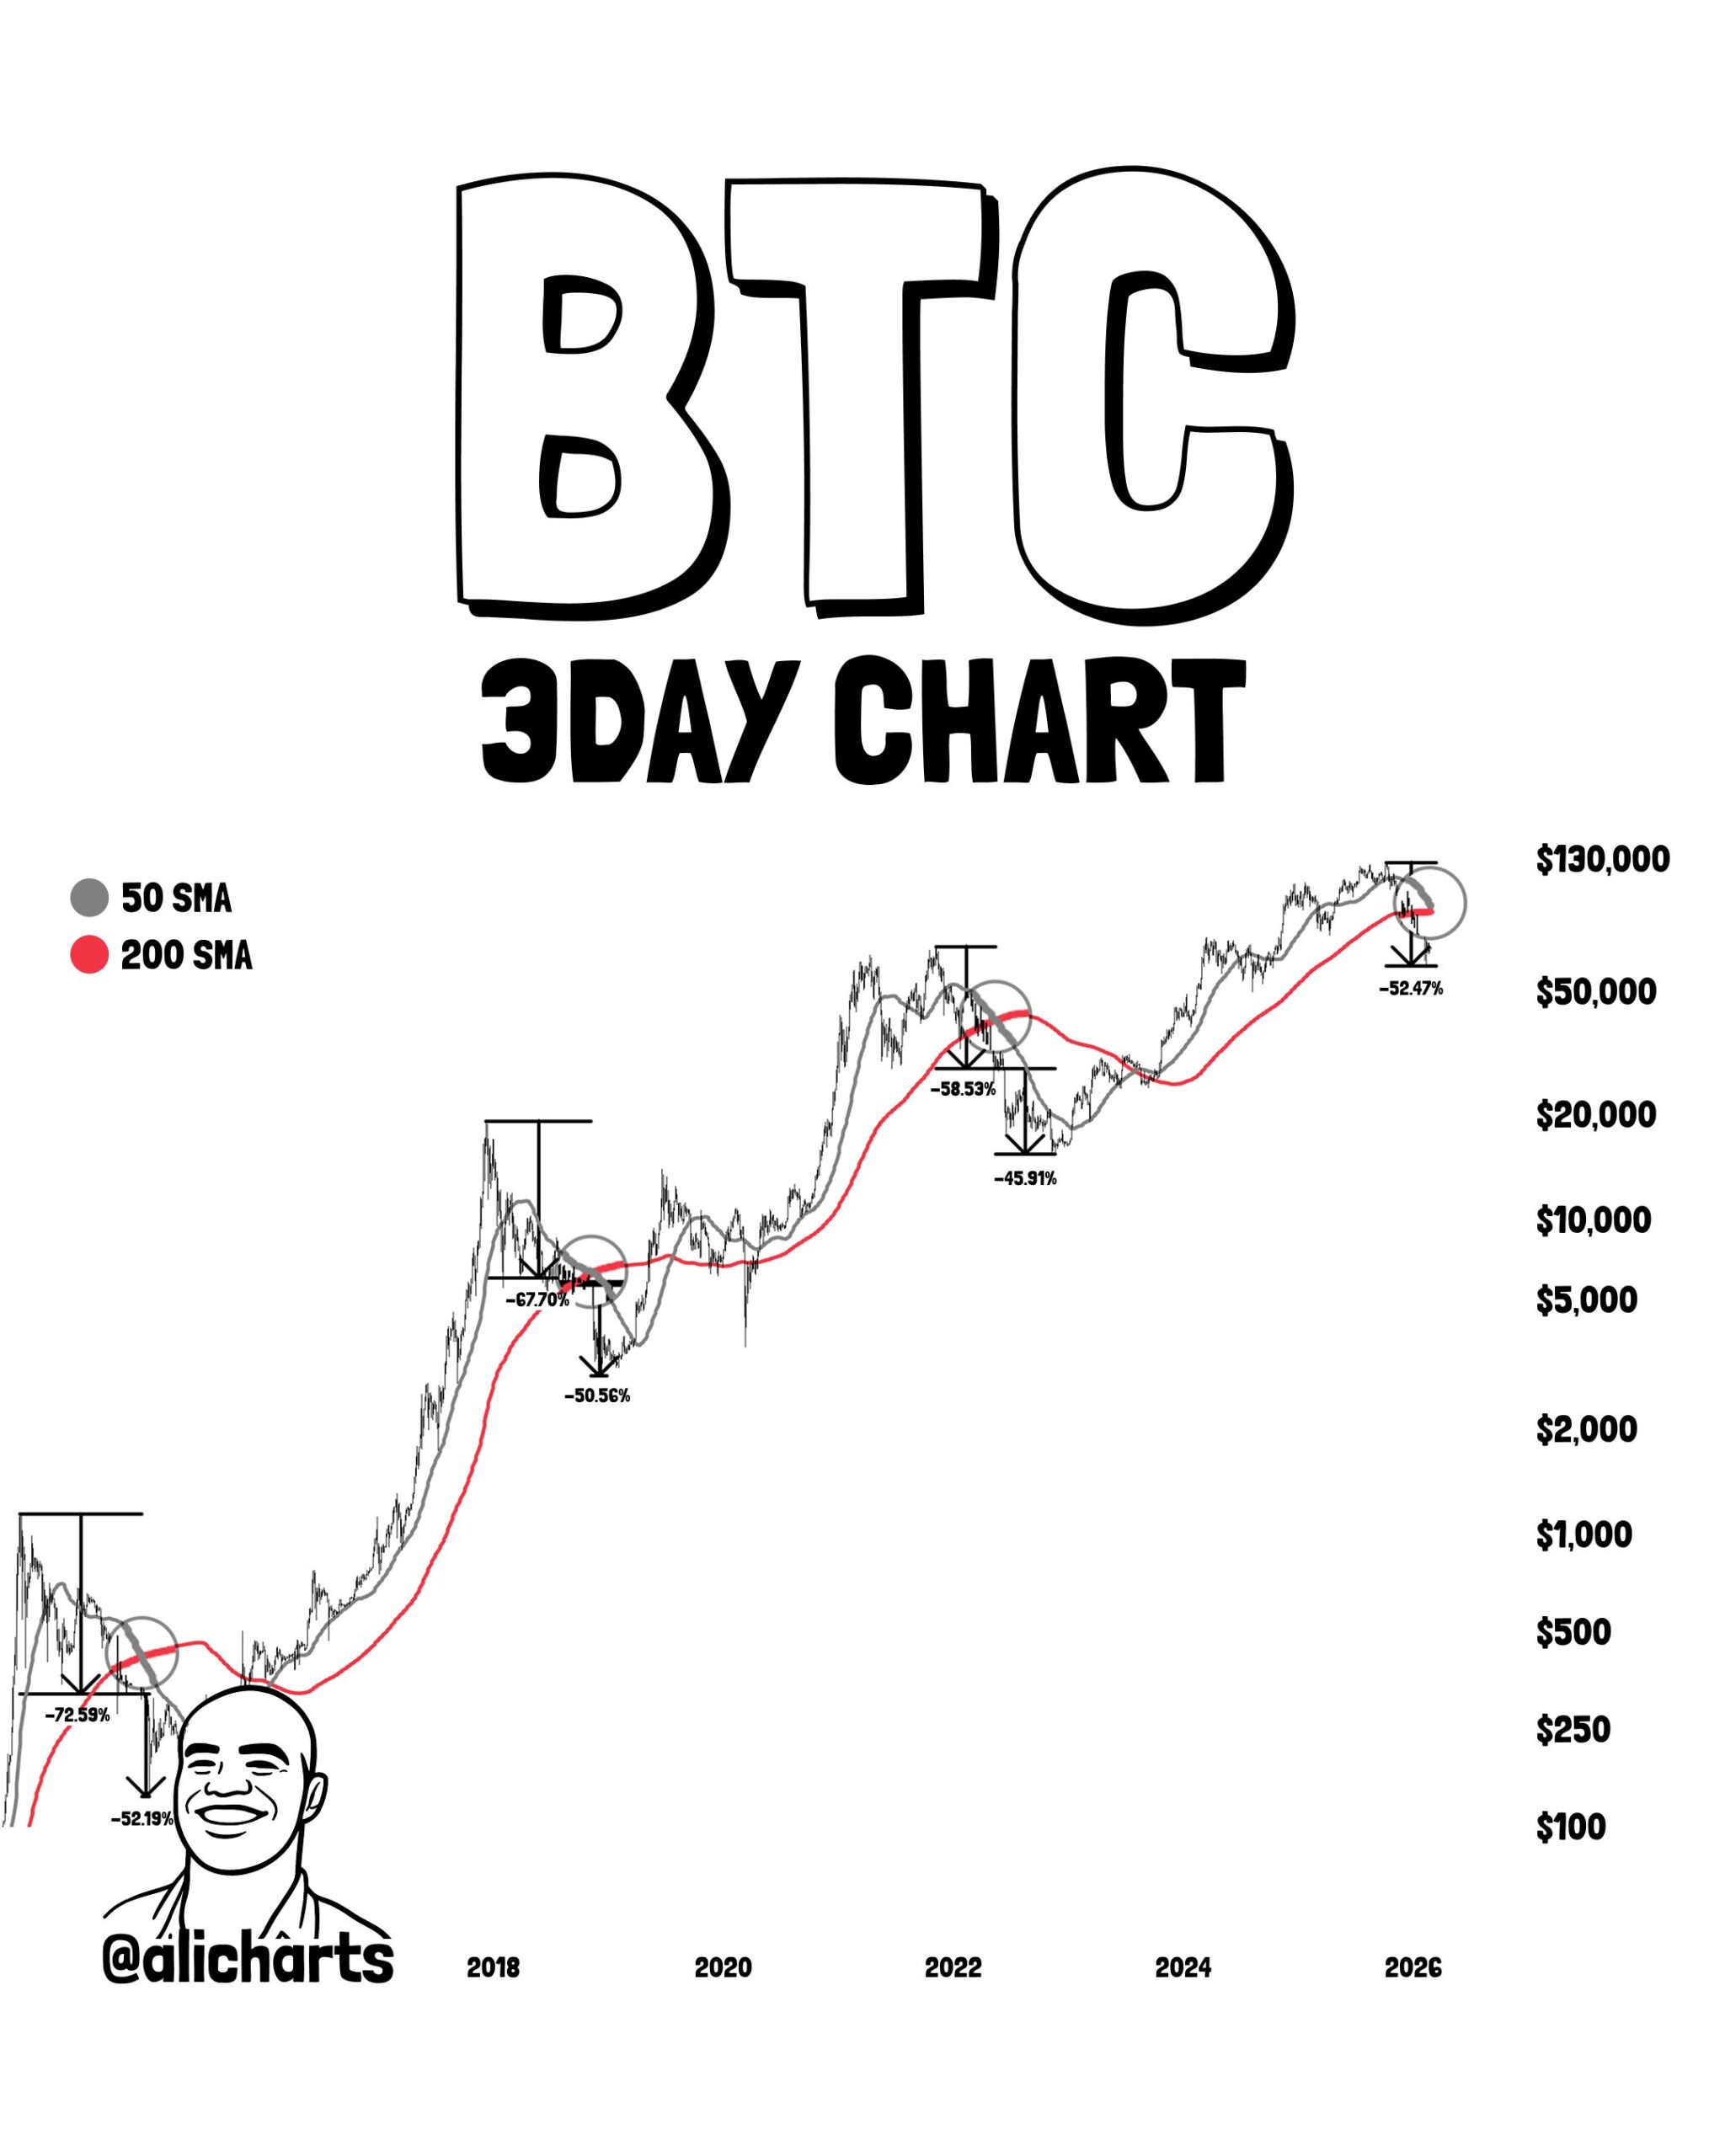
Market expert Ali Martinez has revealed that Bitcoin could be gearing up for a massive surge toward a new all-time high. The analyst shared this bullish outlook in a recent post on X, noting that historically, every transition from a bear to bull cycle has been marked by the crossover of Bitcoin’s 50-day and 200-day simple moving averages (SMAs) on the 3-day timeframe.
According to Martinez, this event signals the final washout phase and a “golden opportunity” for long-term investors. He pointed out that this pattern was evident during the 2014 cycle, when Bitcoin had already declined 72% from its peak above $1,000 the previous year before the crossover appeared in December. Just 23 days later, the market experienced a final 52% crash, marking the last leg down before a new bull run began.
The same structure was repeated in 2018. At the time, Bitcoin had fallen 67% from its nearly $20,000 peak in 2017, largely driven by the ICO boom. The SMA crossover appeared in November, and within 33 days, Bitcoin dropped another 50%, creating what Martinez described as “the ultimate accumulation zone for long-term holders.”
Bitcoin Outshines Gold, Oil, and Stocks During Six Years of Global Instability
2022 Bear Market Validates Historical Pattern
The 2022 bear market further validated the recurring pattern. Bitcoin had already dipped by 50% from its near-$70,000 peak when the SMA crossover occurred in May. However, just 33 days later, the market plunged by an additional 45%, driven largely by the collapse of FTX and the catastrophic failure of the Terra (LUNA) ecosystem.
Interestingly, while this sharp decline created a compelling buying opportunity for long-term investors, the market structure was not yet fully complete. BTC went on to form another lower low approximately 156 days later, effectively concluding the bear cycle and setting the stage for the next bullish phase.
Final Washout Window May Be Imminent
In his broader thesis, Martinez claims that, following the October 2025 peak when Bitcoin surged to $126,000, the asset has since declined by approximately 52%. A closer look at the 3-day chart shows that the critical SMA crossover appeared on February 27, 2026, placing the market firmly within the historical “pre-capitulation” window.
As of press time, Martinez notes that Bitcoin is now roughly 30 days into this signal. If historical patterns continue to rhyme, the final accumulation window could emerge within the next three to six days. During this phase, he suggests Bitcoin could experience a standard 30% correction to $40,000, or, in a more extreme scenario, a full 50% washout to $30,000.
However, Martinez cautions that this framework does not guarantee an immediate downturn, but rather signals that what he describes as the “sale of the century” may be approaching. According to CoinMarketCap, BTC is trading above $67,000, reflecting a relatively neutral stance over the past 24 hours as market participants await further confirmation.


