


Bitcoin’s leveraged market is at a critical point, as data from Coinglass’ Bitcoin Exchange Liquidation Map shows that more than $3 billion in cumulative long liquidation is concentrated at the $65,000 price level. This zone has become the center of focus for traders as BTC hovers around $68,500, already under pressure from multiple bearish factors converging in the market.
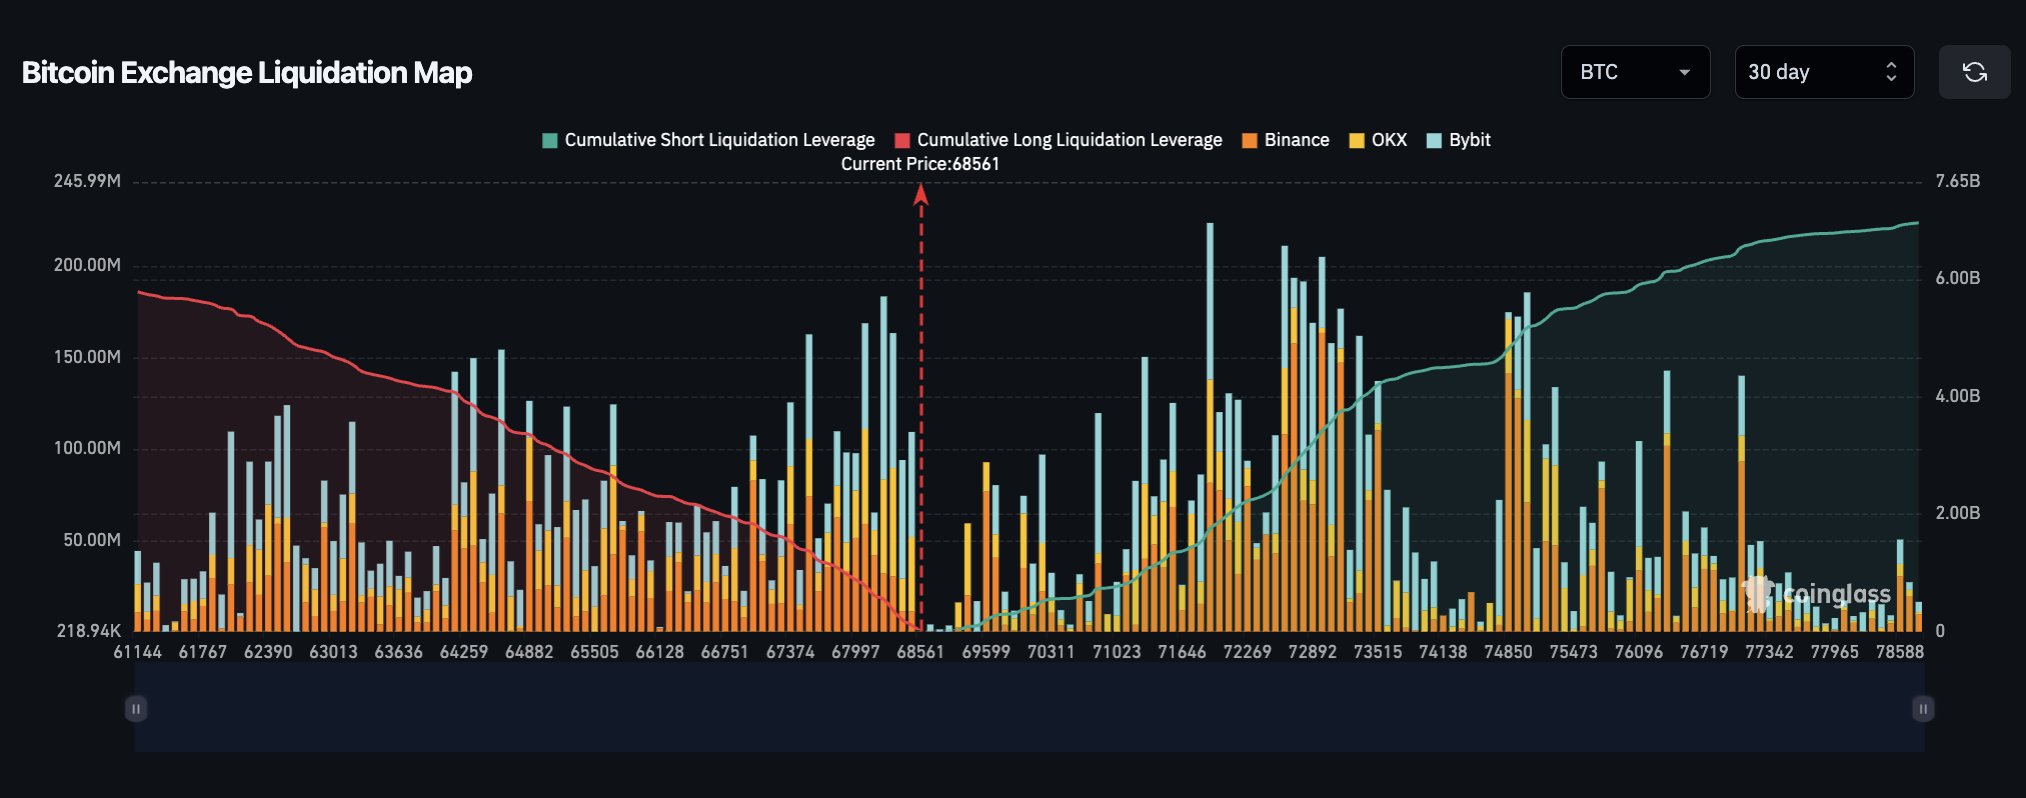
The liquidation map is an aggregate of leveraged positions across top exchanges, including Binance, OKX, and Bybit. The map clearly demonstrates that bulls are heavily positioned, but the margin for error is thin, as selling pressure can push Bitcoin below $65,000, causing liquidation to the tune of a whopping $3 billion.
Further Decline Possible
When leveraged long positions are forcibly closed, the resulting pressure can quickly compound. As the premier asset trades near the liquidation zone and a $3 billion loss looms, a liquidation cascade may result, causing extreme short-term volatility, especially in a market facing macroeconomic uncertainties.
As Bitcoin is just roughly $3,500 above the $65,000 threshold, market participants may start to exercise caution with leveraged exposure. The market is already under pressure from geopolitical tensions, which are straining global finances.
Also, major sell-offs like the legacy whale that sold off $71 million of Bitcoin are hitting the market in recent times. However, institutions keep accumulating as Strategy added another 22,337 BTC to their portfolio in a recent purchase.
Meanwhile, a liquidation of this magnitude could also affect the broader market adversely, similar to the infamous October 10 liquidation event that saw a staggering $19 billion wiped from the crypto market in 24 hours, causing many altcoins to plummet between 50% to 70%. The event also followed a similar pattern of heavy build-up leveraged positions at a key price level across major exchanges. When the positions were wiped, massive sell-offs resulted, leading to further declines.
Expert Projections for Bitcoin
On-chain data suggests BTC may be moving into its most frustrating cycle as conflicting signals make it difficult to call the next direction. While Standard Chartered forecasts Bitcoin could hit $150,000 in late 2026, analysts are uncertain about its short-term performance.
Analyst Ali Chart says Bitcoin is in a No-trade zone, stuck between $70,685 and $65,636, where over $1.72 million BTC have transacted so far. He says, BTC’s next price target is unclear until it breaks above $70,685 or slides below $65,636.


