


Solana has exhibited consistent price patterns over several months. Analyst Kamran Asghar highlighted this trend through chart observations, noting a recurring pattern in SOL’s market structure.
The data shows a consistent setup of consolidation followed by strong upward moves. For context, in April, the token jumped 87.77% from its base. A second rally followed in July after a period of consolidation. Solana grew by 57.99% after breaking out of a descending consolidatory pattern.
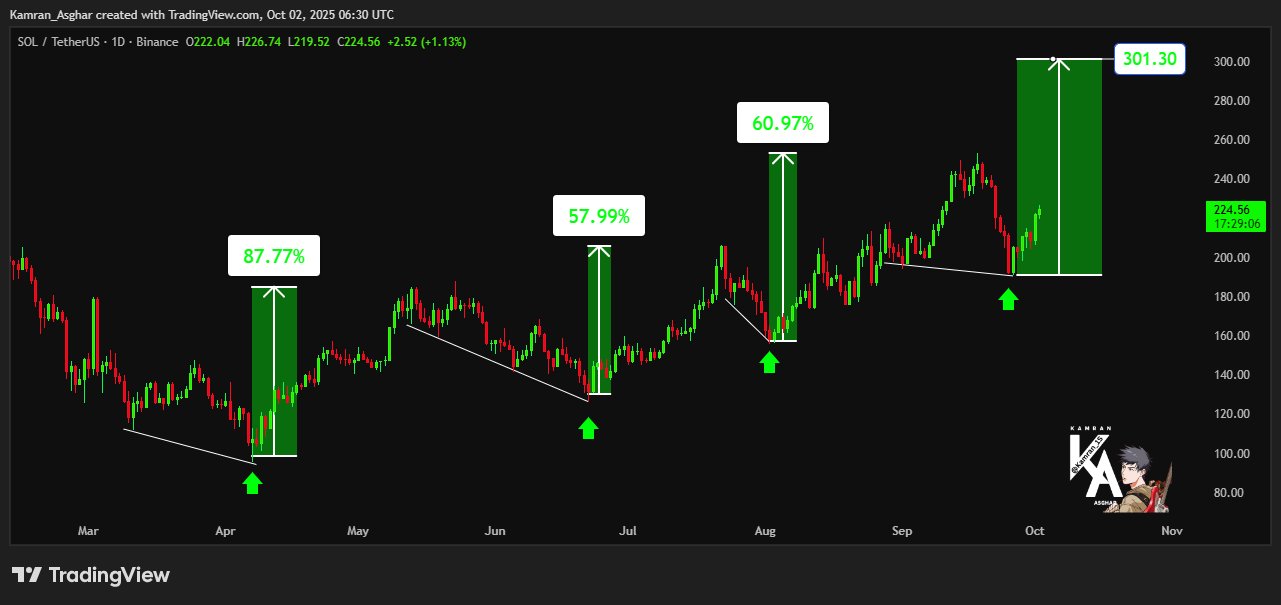
By August, SOL staged another 60.97% rise after a brief consolidation. Notably, each breakout followed a descending structure that eventually reversed upward with force. These repeated swings provide context for the current price movement.
Now, the chart suggests a similar setup is unfolding again. Following recent consolidation near $180–$200, Solana’s price has begun to climb. The analyst’s projection marks $301.30 as the next key level, representing a 63.34% increase from the base of roughly $184.
Solana Price Breaks Key Resistance with Strong Bullish Momentum
Meanwhile, Solana has regained bullish momentum after a daily surge to $233 with a gain of more than 4% over the past 24 hours. The 1-day chart displays a decisive green candle pushing above the 20-day simple moving average, which sits near $224. This rebound also aligns with the middle Bollinger Band, confirming more decisive price action after recent weakness. The broader range now extends between $192 and $256, providing important levels for traders to monitor.
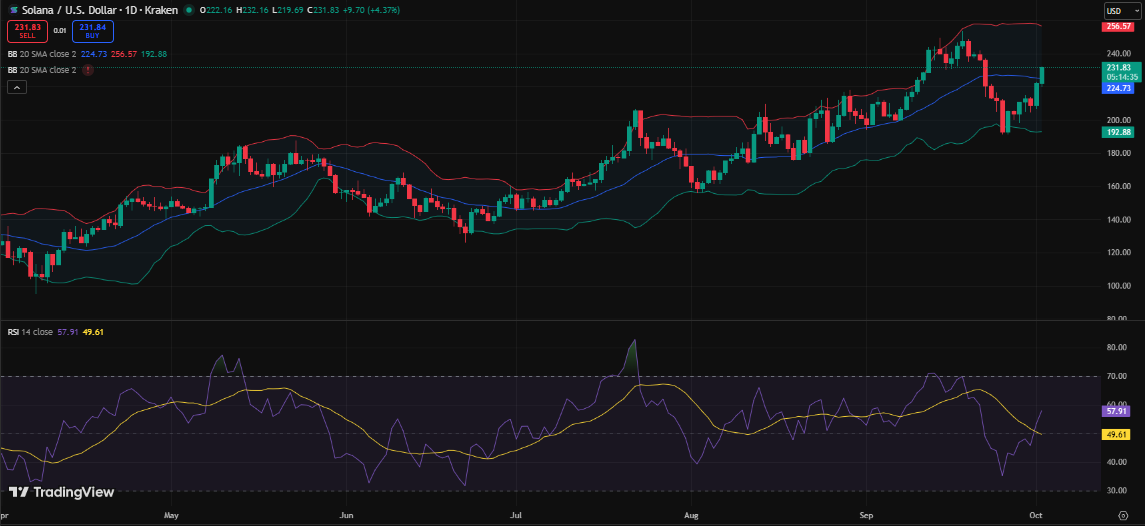
The Bollinger Bands also suggest increasing volatility as the upper band moves higher. A sustained push toward $240 could place Solana’s price near the upper band around $256. The current trend highlights a shift in sentiment, with the price now holding firm above its near-term support.
The Relative Strength Index has risen to 57.9, recovering from recent lows. This improvement suggests a stronger demand entering the market. While the trend appears positive, maintaining levels above $224 remains crucial to overcoming the resistance at $256.


