


Bitcoin may be gearing up for a short-term recovery after a widely followed technical indicator, the TD Sequential, flashed a buy signal on lower timeframes. The development comes as the leading cryptocurrency navigates recent selling pressure and attempts to stabilize near key support levels.
TD Sequential Hints at Trend Reversal
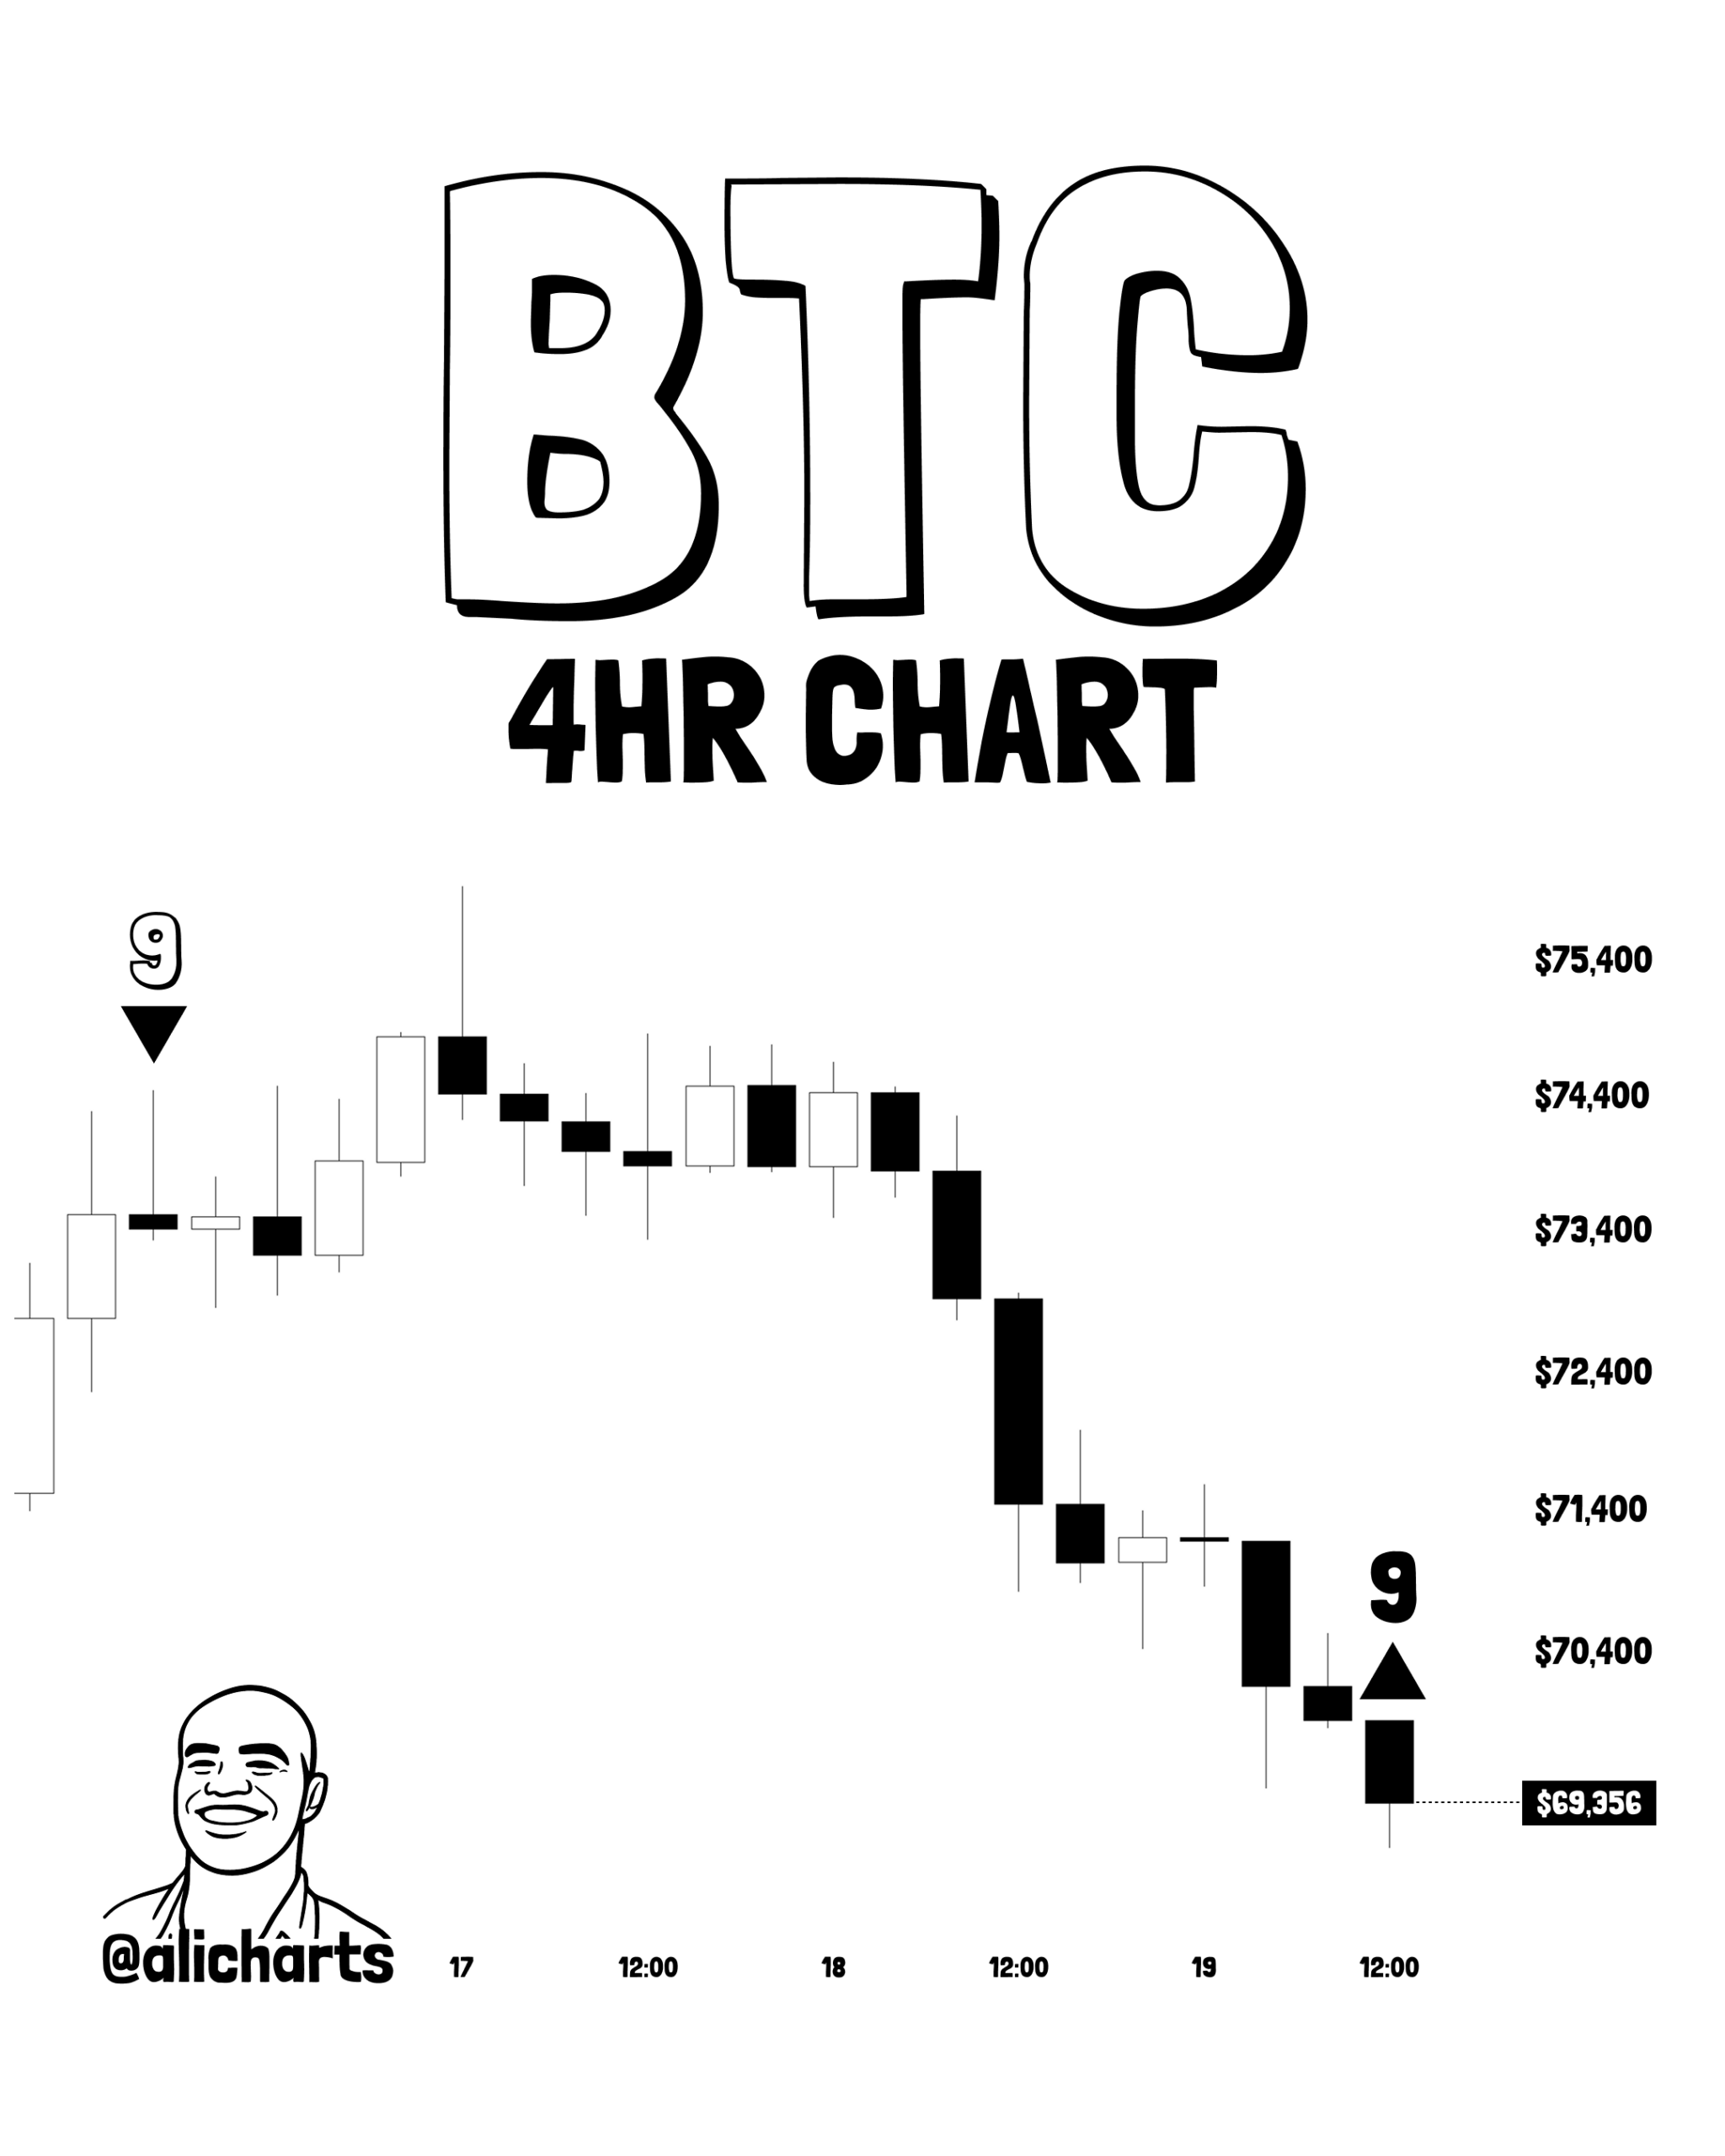
Market expert Ali Martinez revealed on X that Bitcoin’s TD Sequential indicator has flashed a buy signal. Martinez shared this insight after analyzing Bitcoin’s price chart on the 4-hour timeframe, highlighting a potential shift in short-term market momentum. In technical analysis, the TD Sequential is an indicator that identifies trend exhaustion and potential price reversals through its setup and countdown metrics.
The appearance of a buy signal typically suggests that selling pressure is weakening, opening the door to a possible rebound. Interestingly, the signal emerged shortly after BTC dipped to the $68,000 region, reinforcing speculation that the asset may be nearing a local bottom. This timing has caught the attention of traders, as such signals often precede relief rallies when confirmed by price action.
Legacy Bitcoin Whale Dumps $71M Worth Of BTC on Binance With 266x Returns
Geopolitical Tensions and Fed Decision Weigh on Bitcoin
Meanwhile, the recent BTC dip was triggered by escalating geopolitical tensions in the Middle East. Iran has continued to mount pressure around the Strait of Hormuz, with reports of the Islamic Revolutionary Guard targeting vessels passing through the critical waterway despite stern warnings. The situation intensified further following a reported strike on Israel’s Haifa oil refinery, the largest in the country, which added to global market uncertainty and led to a further spike in oil prices.
Interestingly, beyond Bitcoin’s price action, institutional products have also felt the pressure. Data from SoSoValue shows that Bitcoin ETFs recorded net outflows totaling $163.52 million, highlighting the broader impact of recent macro and geopolitical developments
Adding to the mixed outlook, the latest FOMC meeting concluded without another rate cut, despite strong market expectations for further monetary easing in 2026 and even into 2027. The decision has injected caution into risk assets, including cryptocurrencies. Nevertheless, on-chain analytics platform Santiment reports that investor sentiment remains largely bullish despite the absence of rate cuts.
Bitcoin Gains Edge Over Gold as Analysts Signal Potential Upside
Market expert Michael Van De Poppe has highlighted a notable shift in the BTC-to-gold dynamic, revealing in a recent X post that the BTC vs. gold chart reversed on the same day the Iran-related conflict began. According to him, this shift suggests Bitcoin is beginning to outperform gold, even amid broader market uncertainty.
He explained that while both assets have faced downward pressure in recent days, gold has declined more sharply, whereas Bitcoin has shown relative resilience by posting smaller losses. This trend has allowed the BTC/Gold chart to climb, signaling a strengthening of Bitcoin’s momentum.
Van De Poppe added that a potential decline in oil prices alongside easing geopolitical tensions could act as a catalyst for further upside in BTC. He emphasized that the current movement in the BTC/Gold metric is a positive development, indicating that market conditions may increasingly favor Bitcoin in the near term.
Bitcoin and the Iran Conflict: Should Investors Sell or Stay the Course?


