


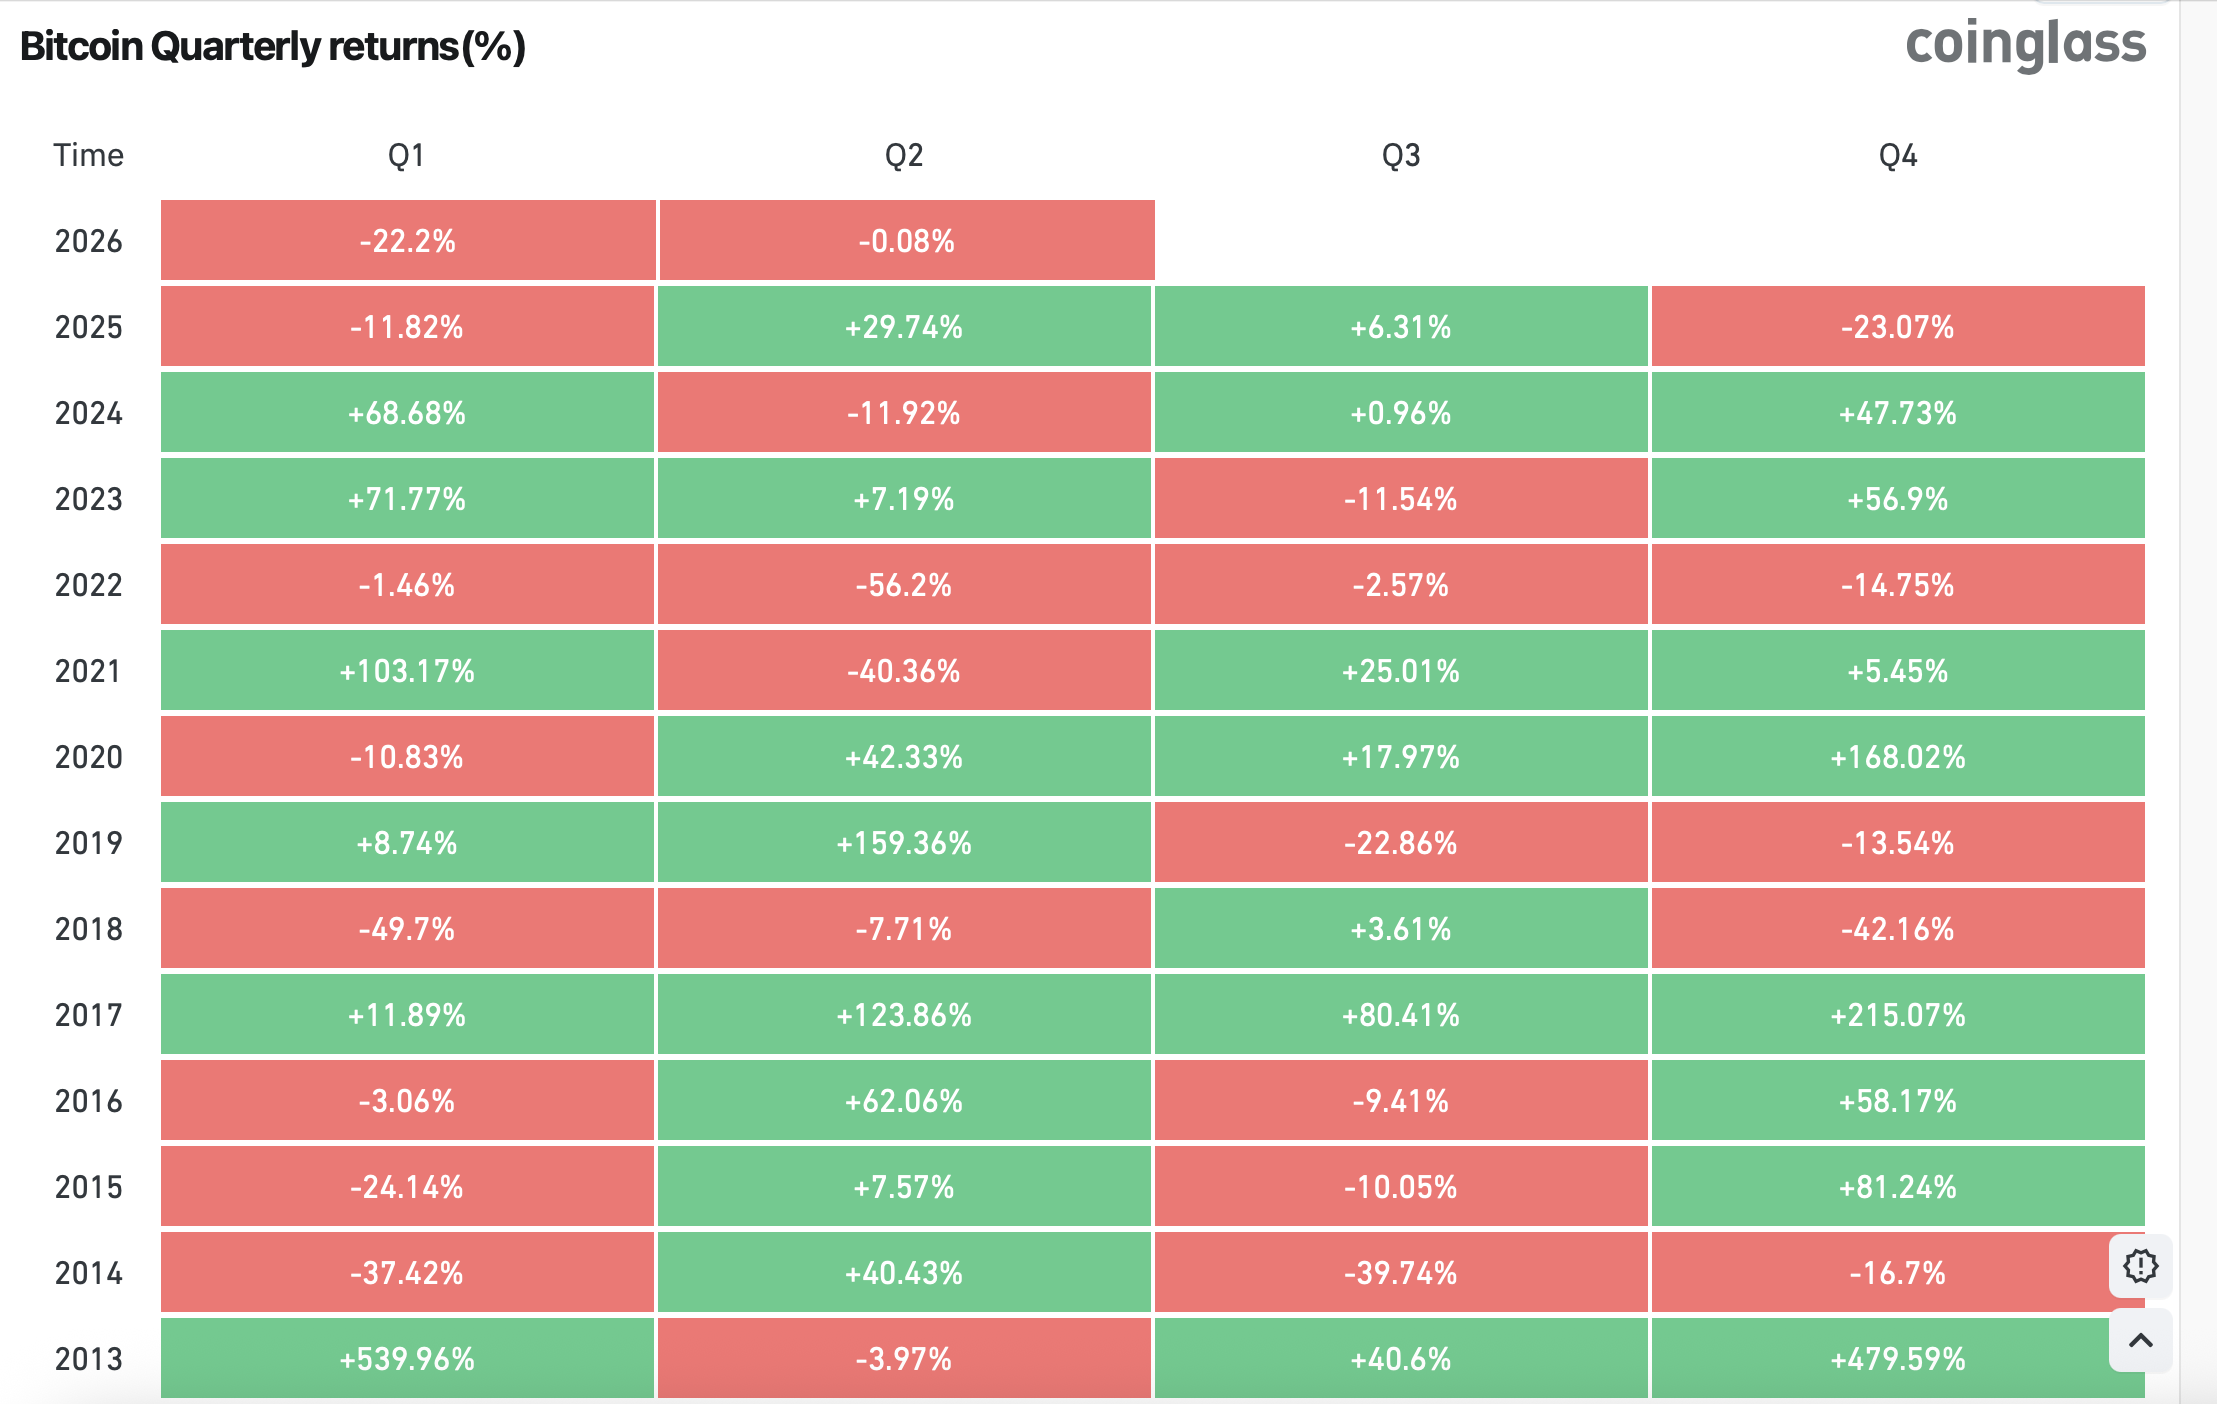
Bitcoin has recorded its worst first-quarter performance since 2018, as volatility and macro uncertainty weighed on the broader crypto market. CoinGlass data revealed Bitcoin’s 22.2% slump in the previous quarter is the worst opening to a fiscal year since Q1 2018, when it dipped 49.7%.
The weak start to 2026 comes despite Bitcoin trading in the high-$90,000 range earlier in the quarter. It follows a series of failed rallies and growing risk-off sentiment that pushed Bitcoin lower throughout March. The digital asset currently trades around $68,400 at the time of writing, reflecting heightened pressure across the crypto market.
Bitcoin Records Worst First Quarter Since 2018
Bitcoin’s 22% decline in Q1 2026 marks its weakest first-quarter performance since 2018, when the market entered a prolonged bear cycle following the 2017 rally. This comparison underscores the scale of the current correction after Bitcoin posted stronger starts in preceding years.
Earlier in the quarter, BTC traded above $97,000. Investors and analysts predicted new peaks of $150,000 or, as in one particularly bullish projection, $300,000. However, the rally failed to hold, with price action reversing as selling pressure increased. The subsequent pullback contributed to the broader quarterly decline.
Recent price action shows how Bitcoin’s weakness intensified toward the end of the quarter. In March, Bitcoin dropped about 10% from its monthly high of $75,620 to its current price of $68,500. The slump followed a rejection near $75,000, which had previously acted as support.
Macro Pressure and Market Sentiment Weigh on Bitcoin
Geopolitical developments also contributed to market caution. Expectations for an amicable agreement between the United States and Iran weakened, adding uncertainty to global markets. This shift in sentiment coincided with increased volatility in crypto prices. Liquidity conditions also tightened as inflation concerns grew, further contributing to the downward pressure on Bitcoin and other major digital assets.
Additionally, the headlock between crypto firms and institutional banking companies over stablecoin reserve yields in the CLARITY Act cast a dark cloud over the cryptocurrency market in the first quarter. Despite calls from either side to reach an agreement before May 2026, the most recent iteration of the bill widened the chasm further by excluding yield on consumers’ stablecoin balances.
The broader crypto market also experienced declines during the same period. Ethereum fell below recent highs while several altcoins posted double-digit losses. Memecoins were also not spared from the broader risk-off sentiment. According to CryptoQuant, nearly 38% of altcoins were trading near their all-time lows during Q1 2026.
Traders Watch Key Support Levels
Traders are currently monitoring key support levels on the BTC price chart. The $65,000 level still acts as short-term support, while $60,000 remains a major psychological level below.
A break below these levels could open the door to further downside, while stabilization may allow buyers to re-enter the market. Market participants are also watching liquidity conditions, including rising stablecoin issuance and macro developments, for signs of the next move.
With Bitcoin recording its worst first quarter since 2018, traders are hoping the second quarter will bring renewed momentum.


