


In today’s crypto news, Bitcoin has suffered one of its sharpest declines in recent weeks. The premier cryptocurrency fell below the critical $70,000 level as investors reacted to a combination of geopolitical tensions, institutional selling pressure, and persistent ETF outflows. The asset dropped from roughly $73,000 just a day earlier to as low as $69,800 this morning.
Why Bitcoin Is Falling
Several factors appear to be driving the latest selloff. The most immediate catalyst came when a recent filing revealed that strategy had sold 32 BTC. Although negligible relative to its over 804,000 BTC holdings, the sale triggered negative market sentiment as it broke Chairman Michael Saylor’s “never sell” creed. Following the news, Bitcoin, which was trading at $72,000 at the time, began a lengthy plunge that would eventually see the token shred about 3% off its price value.
Renewed military escalation between the United States and Iran caused market sentiment to break down further. Ongoing resolution efforts broke down after Iran announced yesterday it was pulling away from the peace talks over the U.S. and Israel’s repeated ceasefire violations. Iran also threatened to completely block the Strait of Hormuz. The renewed tensions triggered another wave of risk-off sentiment across cryptocurrencies as the crypto market capitalization slumped 2.44% to $2.4 trillion.
The weakness was amplified by ongoing pressure from Bitcoin exchange-traded funds. Spot Bitcoin ETFs continue to extend their net outflows streak and have now lost over $4.3 billion in the last three weeks. These products were among the largest sources of Bitcoin demand throughout the bull market. Thus, when ETF flows reverse, one of the market’s strongest support mechanisms disappears.
Technical indicators added further pressure. Popular analyst Ted Pillows recently warned that Bitcoin’s daily Relative Strength Index had broken its uptrend structure. Shortly after that signal appeared, Bitcoin declined roughly 13%, validating concerns that momentum was weakening.
What Could Bring Bitcoin Back Higher?
Despite the ongoing panic, several potential catalysts could support a recovery. The first would be a reversal in ETF flows. During Bitcoin’s strongest rallies this cycle, spot ETFs absorbed billions of dollars worth of BTC from the market. If institutional demand returns and ETF inflows resume, Bitcoin could quickly regain lost momentum.
De-escalating tensions between the United States and Iran would also help restore risk appetite across financial markets. Bitcoin has become macro-sensitive recently, as the current weakness shows. Thus, improving geopolitical and macroeconomic conditions could improve risk appetite across the market and help support a broad price recovery.
Institutional buying could provide another major boost. Many traders associate institutional buying with bullish conditions and institutional selling with weakness. Thus, if institutional investors such as BlackRock and Strategy resume accumulation, sentiment could shift rapidly.
Technically, Bitcoin could also benefit from reclaiming the $70,000-$72,000 region. Recovering that support zone could reduce fears of a deeper correction. It would also attract sidelined investors to re-enter the market, and reassure retail and large-scale investors alike.
Ted Pillows Says The Four-Year Cycle Remains Intact
While short-term conditions remain challenging, some analysts believe a broader market thesis is at play. Ted Pillows recently shared a long-term chart comparing Bitcoin’s current price action with previous market cycles. According to the analysis, Bitcoin has historically experienced a macro downtrend phase before breaking out into new all-time highs.
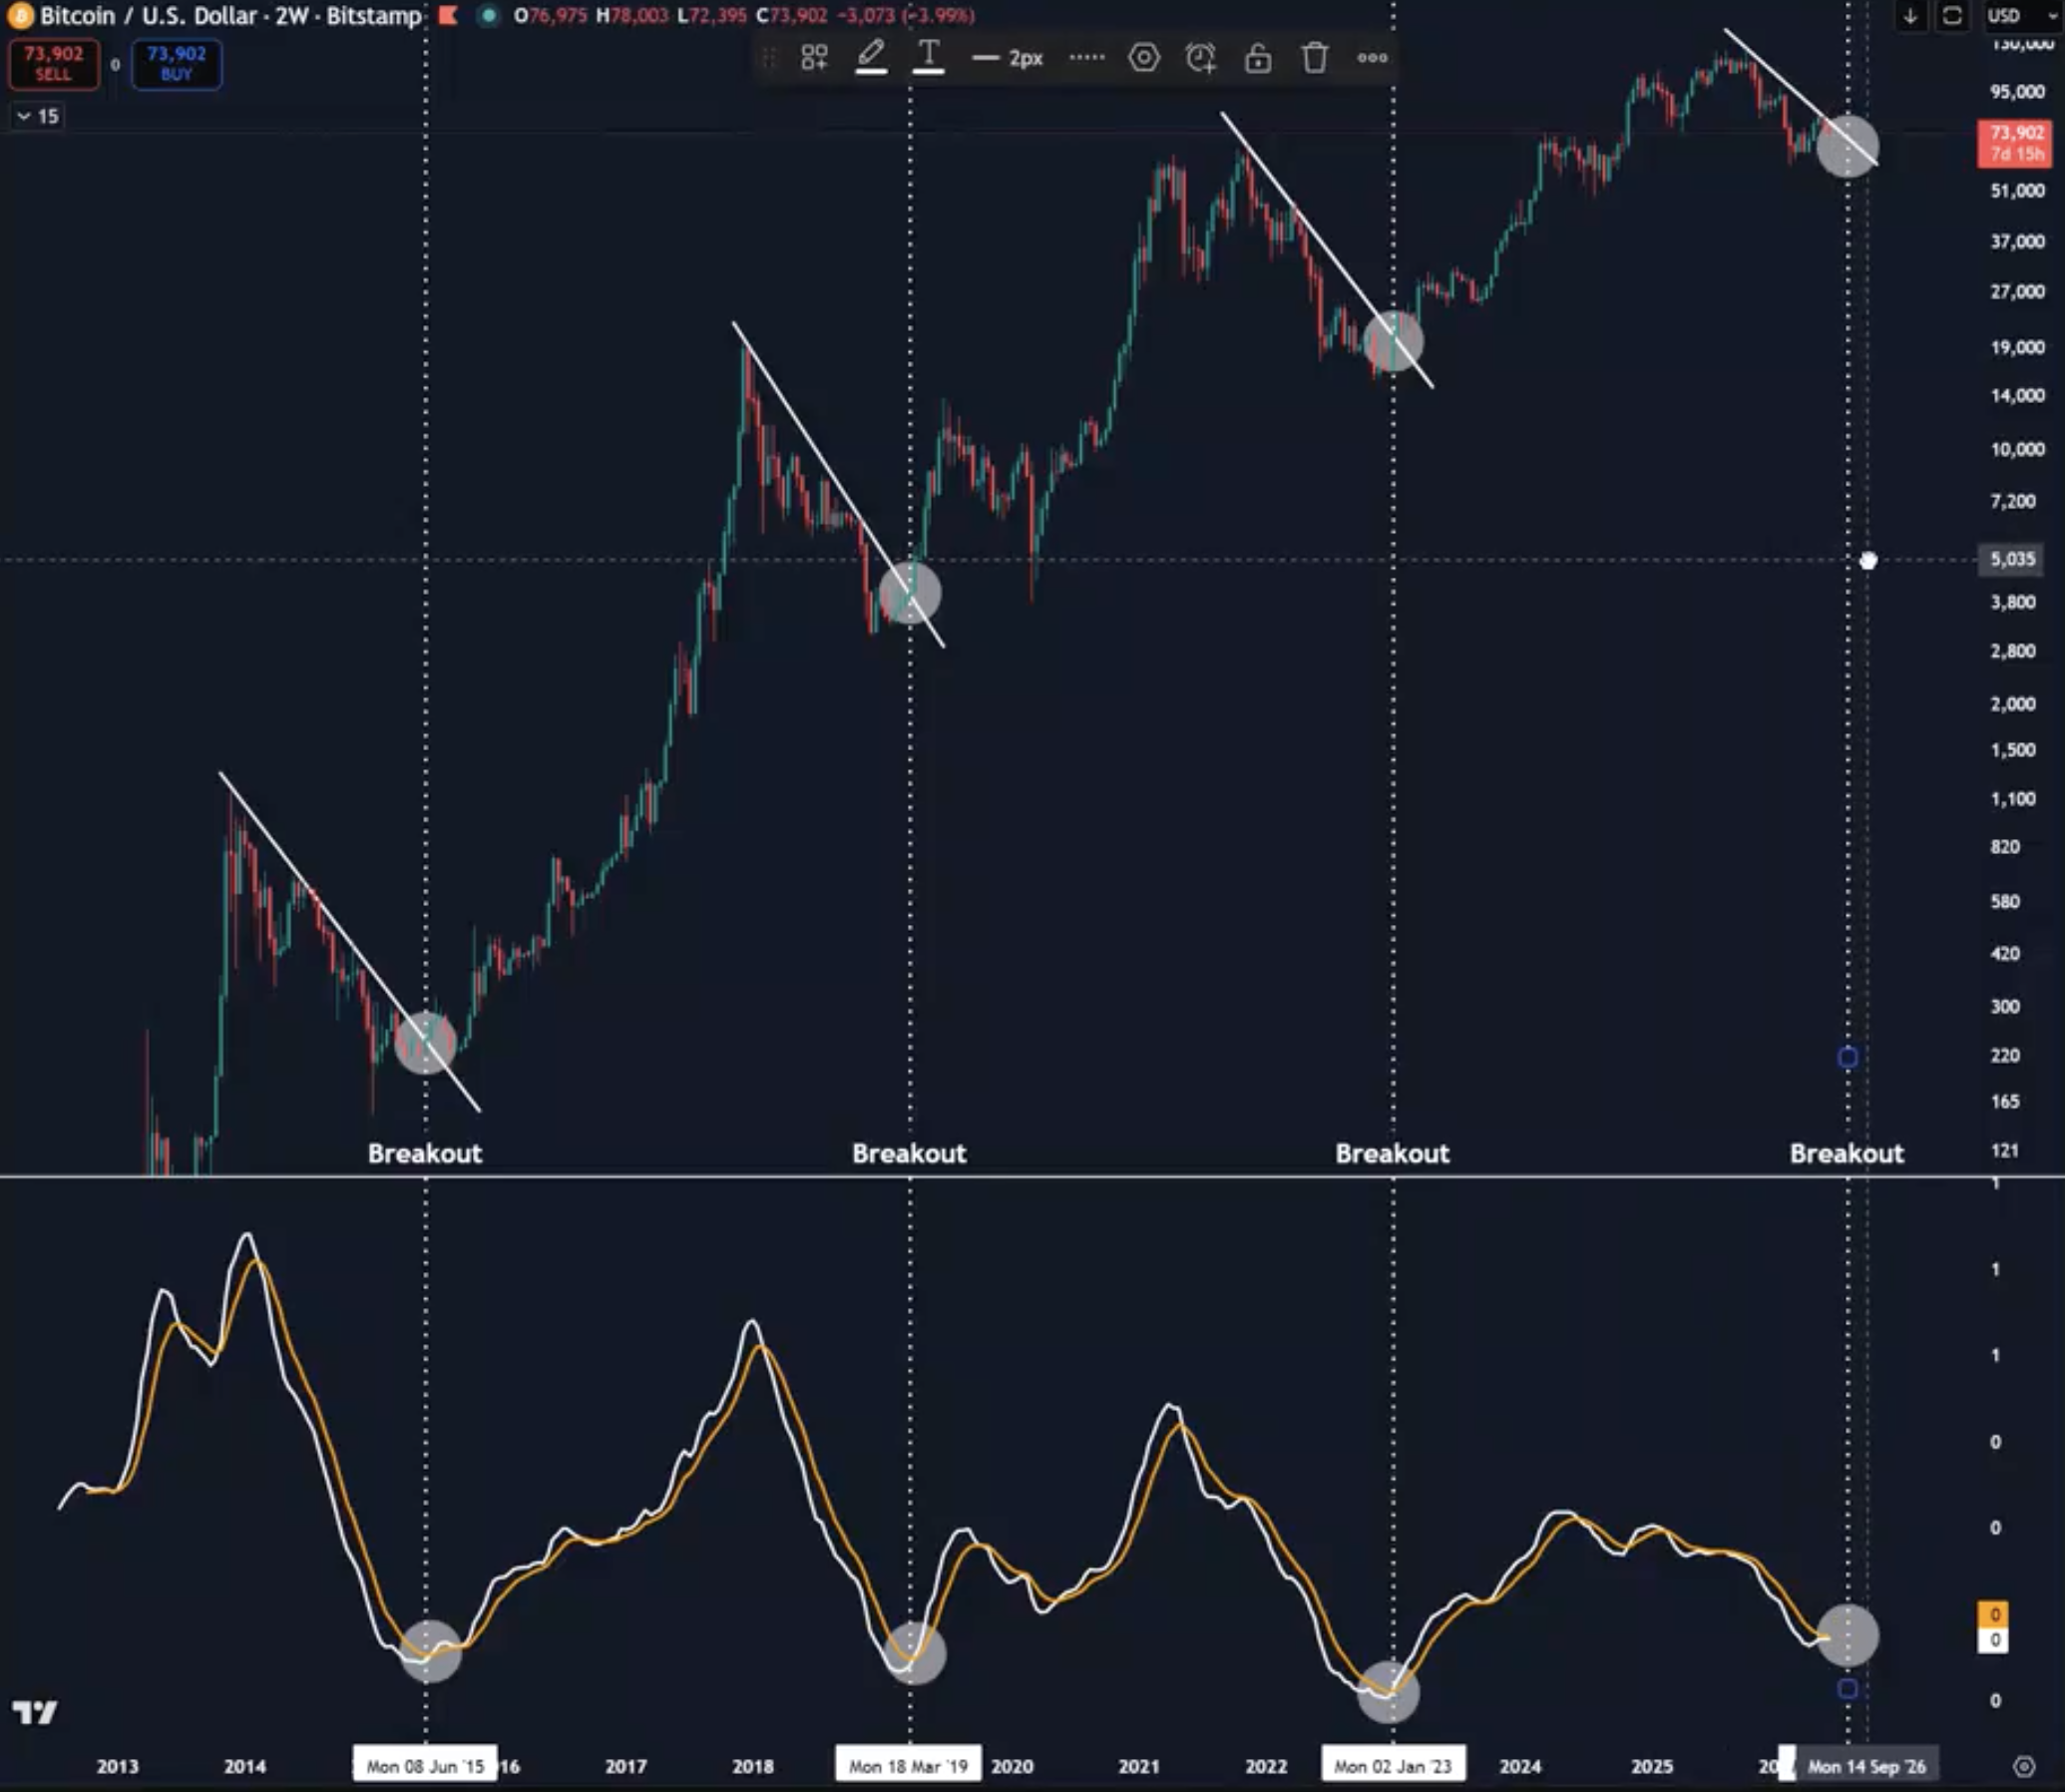
The chart highlights similar periods in 2015, 2019, and 2023 when Bitcoin spent months consolidating or declining before eventually breaking trendlines and entering powerful rallies. Ted argues that the current market structure resembles those earlier periods. Hence, the latest drop below $70,000 may represent just another phase in Bitcoin’s four-year cycle, and may precede a climb to new all-time highs in the coming months.


