



Bitcoin (BTC) dropped toward $75,000 after the U.S. Senate failed to advance the Clarity Act, adding fresh pressure to an already weakening market structure. The procedural vote ended 49-50, falling short of the 60 votes required to move the legislation forward.
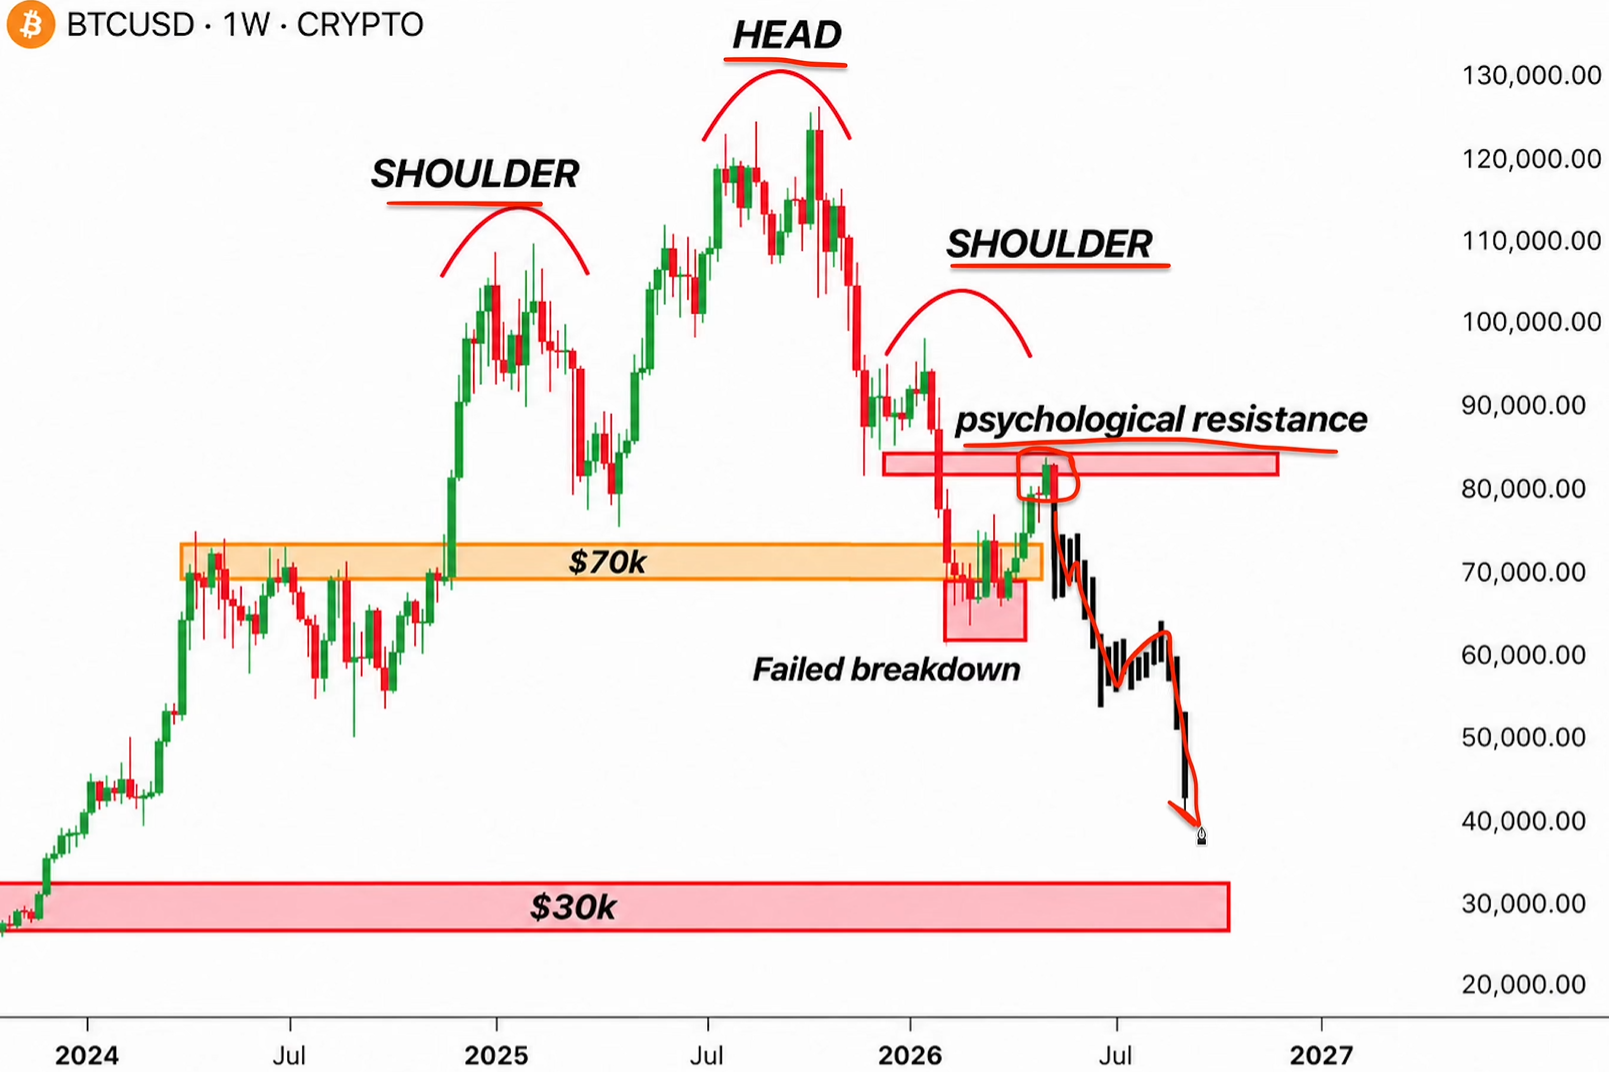
The decline has also brought renewed attention to a bearish head-and-shoulders structure that has been developing on the weekly Bitcoin chart.
Weekly Bitcoin Structure Raises the Risk of Another Leg Lower
The broader formation resembles a head-and-shoulders pattern, with the left shoulder forming around the $100,000 region, the head reaching above $120,000 and the right shoulder developing closer to $95,000.
The pattern became more concerning after Bitcoin broke below the $70,000 area before recovering. That failed breakdown temporarily restored bullish momentum, but the subsequent rejection near the $80,000-$85,000 resistance zone has weakened that recovery.
If the $70,000 support fails again, the next levels highlighted by the structure are around $63,000 and $47,000. A deeper decline could eventually bring the $30,000 region back into focus as a major long-term support area.
That does not mean those levels must be reached. They represent potential downside areas suggested by the structure if selling pressure continues.
$180K Remains the Longer-Term Bullish Scenario
The same market structure leaves room for a much different outcome if Bitcoin can reclaim the major resistance zone and invalidate the bearish setup.
A sustained move back above the $80,000-$85,000 region would weaken the head-and-shoulders thesis and shift attention toward the possibility of a broader recovery.
The bullish scenario outlined in the analysis places $180,000 as a potential longer-term target, while the bearish path focuses first on $70,000, followed by $63,000 and potentially $47,000.
For now, the $70,000 area remains particularly important. Bitcoin’s reaction there could determine whether the recent decline develops into a deeper correction or becomes another failed breakdown.
The Clarity Act setback has added to the pressure, but it does not by itself establish where the Bitcoin cycle will ultimately bottom. The Senate vote stalled the legislation, although the bill has not technically been eliminated from consideration.





 Evans Kelvin